The Square Kilometre Array (SKA) Observatory
will be the largest radio astronomy observatory ever built, consisting of telescopes with unprecedented
sensitivity over a very broad frequency band from 50 MHz to 15.3 GHz. The SKA Observatory will include two components.
A low-frequency (50 - 350 MHz) telescope (SKA-Low) will be built at the
Murchison Radio-astronomy Observatory (MRO) in Western Australia, and a mid-frequency (350 MHz - 14 GHz) telescope
(SKA-Mid) will be hosted by South Africa. These two instruments will operate as the SKA Observatory.
The SKA will revolutionise our understanding by addressing many fundamental questions about the early Universe, the formation of the first stars and galaxies during the Cosmic Dawn, the study of the Epoch of Reionisation (when these first objects re-ionised the neutral hydrogen), the evolution of galaxies, cosmic magnetism, extraterrestrial life, astrophysical transients, general relativity, pulsars and black holes, and high energy cosmic-rays. The SKA will also very likely lead to completely new and unexpected discoveries.
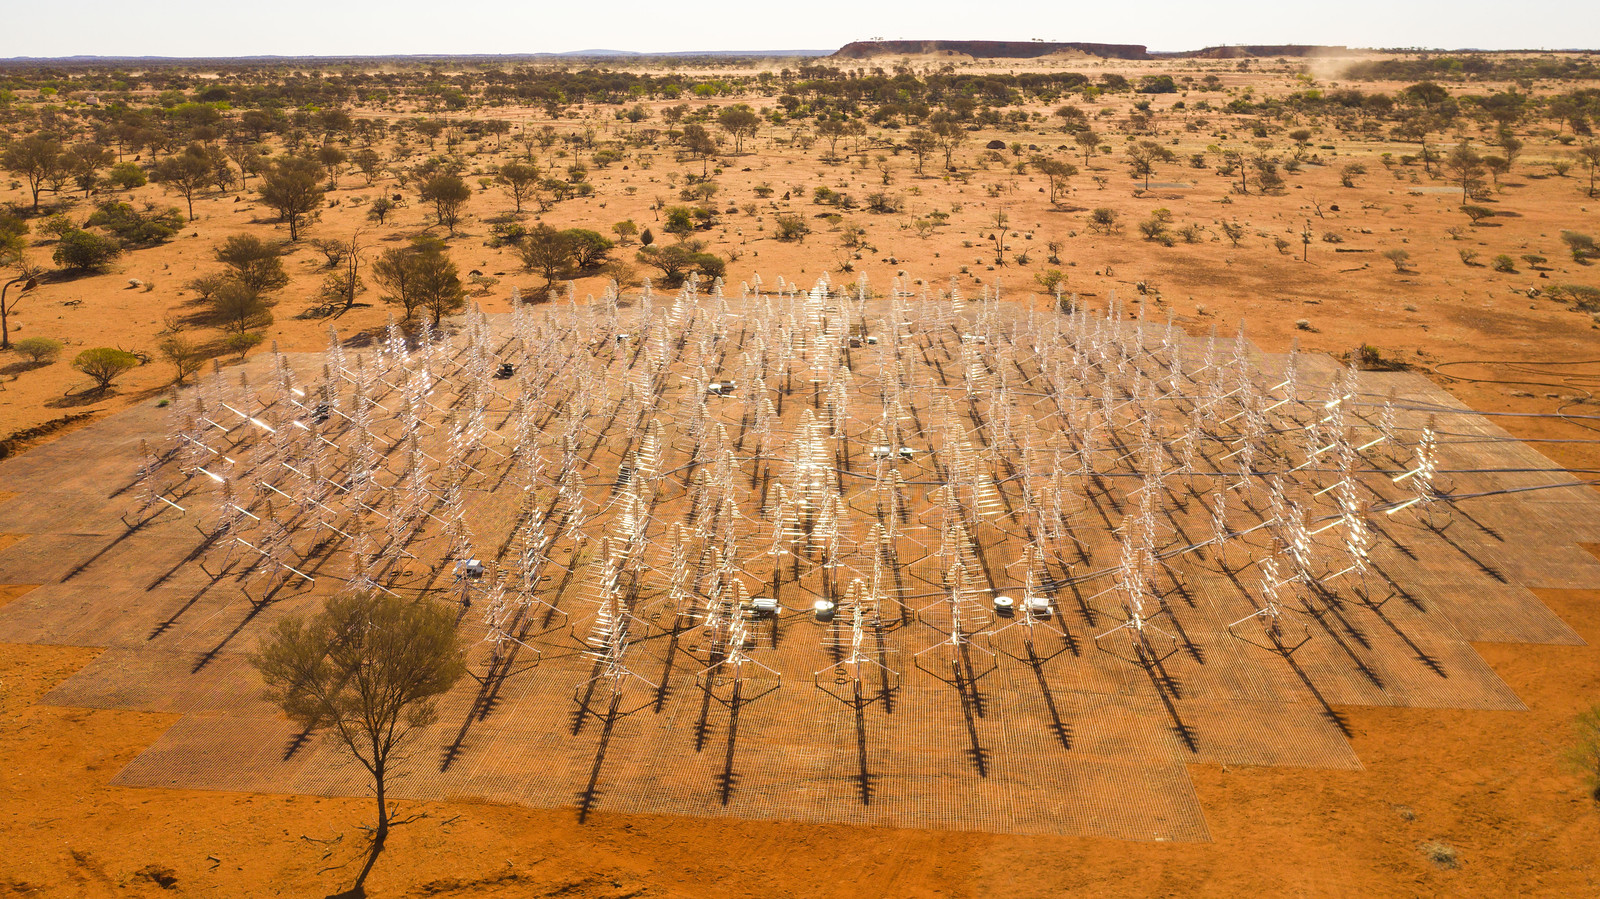
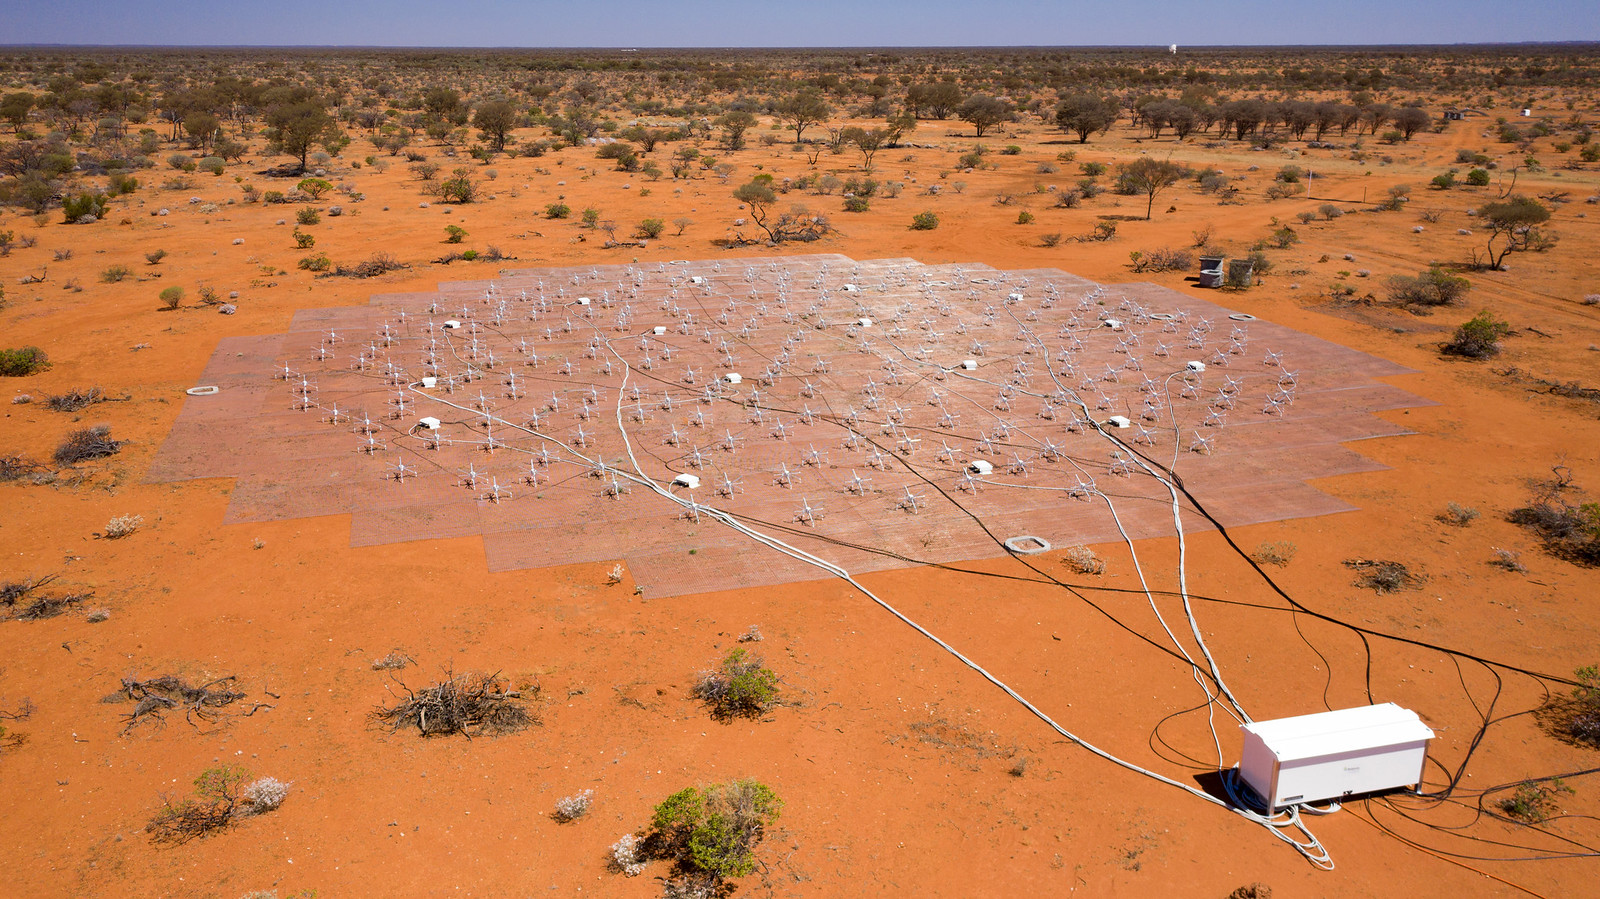
All the SKA-Low science goals rely heavily on its unprecedented broad-band sensitivity, which will result from the enormous number of individual antennas (131,072) providing an effective area of the order of a square kilometre. SKA-Low will consist of 512 stations, each composed of 256 dual-polarised antennas. Hence, the sensitivity of an individual station is pivotal to the performance of the entire SKA-Low telescope and the realisation of its science goals. In 2019, two prototype SKA-Low stations, designed to explore the performance of the final selected technologies, the Engineering Development Array 2 (EDA2) shown in the right image and the Aperture Array Verification System 2 (AAVS2) shown in the top image were deployed at the MRO. They use the same signal chain technologies and the same pseudo-random antenna layout, but the antenna designs in both stations are different.
The EDA2 station consists of 256 MWA bowtie dipoles, whilst the AAVS2 station is composed of SKALA4.1AL antennas (the selected antenna technology for SKA-Low). These two stations were built in order to explore and verify the performance of the selected technologies, including calibration and sensitivity. The different antenna designs were used to compare performance against each other, against the SKA-Low requirements, and against predictions of simulations. The results of these studies, in particular the comparisons between the predicted and measured sensitivities, have been published for both EDA2 and AAVS2 stations (paper1 and paper2, respectively).
The expected sensitivities calculated in paper1 and paper2 use an array-factor method. The details of these calculations are described in Sokolowski et al., 2022, PASA, in press. The underlying python package has also been published on https://github.com/marcinsokolowski/station_beam. This package has been used to pre-compute sensitivity values in 10 MHz steps at frequencies from 50 to 350 MHz, in 1/2 hour LST intervals, and 5 degree pointing direction resolution. The sensitivity was tabularised as System Equivalent Flux Density (SEFD) and effective area divided by system temperature (A/T) for X, Y, and Stokes I polarisations. Access to this database is provided by this web interface. The accuracy of the calculator is approximately 10 - 20% at elevations above 45 degrees, and may be worse at lower elevations. To submit a bug report or get in contact, email marcin.sokolowski@curtin.edu.au or visit the GitHub link above.
This option enables the calculation of the sensitivity of the SKA-Low telescope (default number of stations is 512) in the specified pointing direction (right ascension and declination), during the time range of the observations (hour angle range), and for specified observing bandwidth and integration period (default of 120 seconds). The calculated result is the standard deviation (imaging sensitivity) of the mean image resulting from averaging multiple snapshot images of the specified integration time. The option also shows how the sensitivity (A/T) changes as a function of time during the specified observing interval.
This option enables the calculation of the sensitivity (A/T) of a single SKA-Low station as a function of frequency toward the specified pointing direction (right ascension and declination).
This option enables the calculation of the sensitivity (A/T) of a single SKA-Low station as a function of Local Sidereal Time (LST) in the specified pointing direction (right ascension and declination).
This option enables the calculation of the sensitivity (A/T) of a single SKA-Low station as a function of frequency for the specified pointing direction in local coordinates (azimuth and elevation).
This option enables the calculation of the sensitivity (A/T) of a single SKA-Low station as a function of Local Sidereal Time (LST) in the specified pointing direction in local coordinates (azimuth and elevation).
This option generates a map of sensitivity (A/T) over the entire visible hemisphere (all-sky sensitivity map).
In all cases, the station design can be selected to be either AAVS2 or EDA2. The interface returns results as plots of sensitivity (A/T) as a function of the various parameters (described above) and can also return these data as images or text files in a single compressed archive file.